What is the OM Performance dashboard? The OM Performance dashboard was created using Salesforce Reporting Snapshots which are built to track historical trends of user activity within custom objects of Salesforce. The purpose of this dashboard is to drive long-term adoption and usage of Opportunity Manager® by easily identifying trends, bright spots, and areas of struggle. Our OM Performance dashboard tracks user activity trends based on the following Opportunity Manager activity:
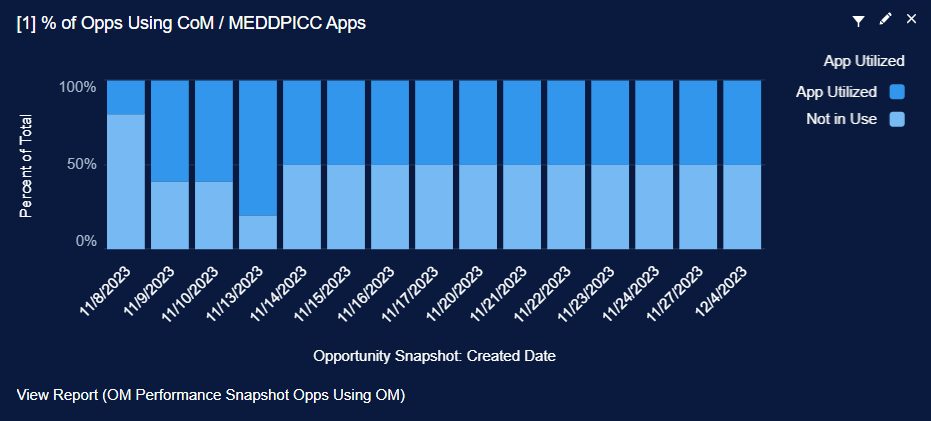
Percent of Opps Using CoM/MEDDPICC Apps:
Percentage of opportunities using Opportunity Manager (1+ fields completed) vs. opportunities not using Opportunity Manager.
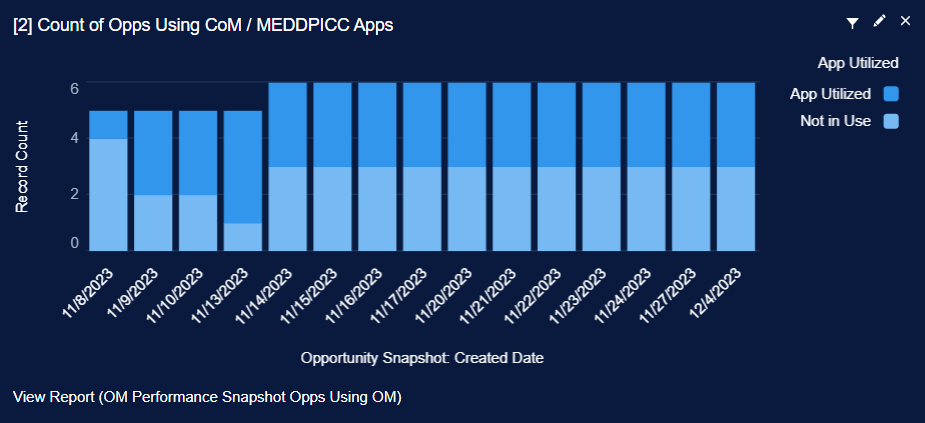
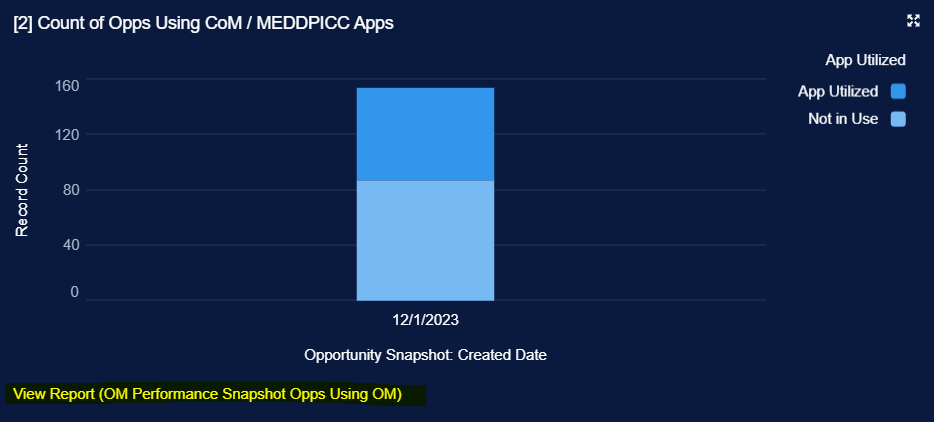
Count of Opps Using CoM/MEDDPICC Apps:
Raw count of opportunities using Opportunity Manager (1+ fields completed) vs. opportunities not using Opportunity Manager.
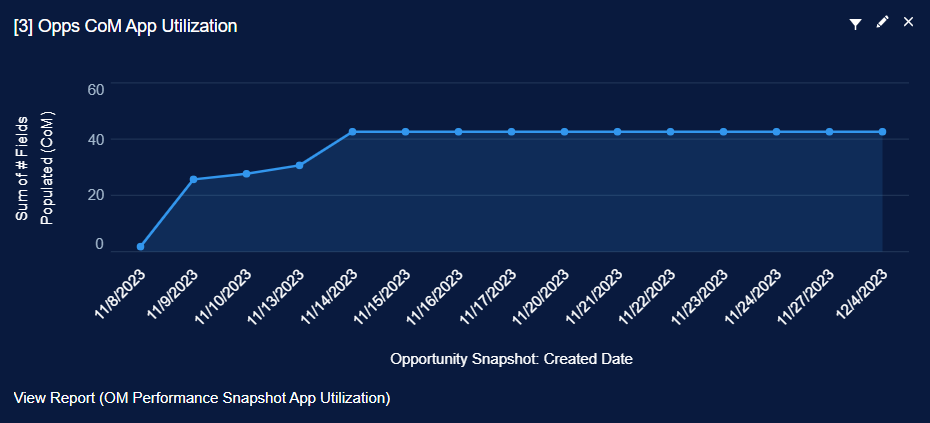
Opps CoM App Utilization:
Count of total fields populated within the Command of the Message Value Card.
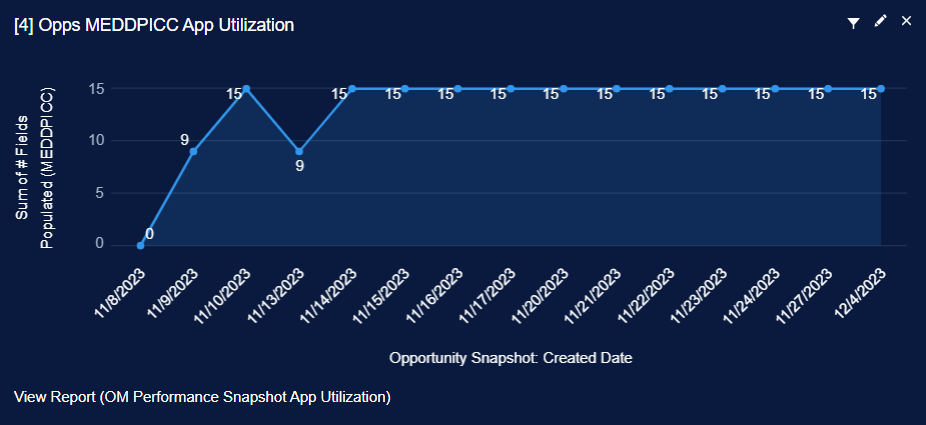
Opps MEDDPICC App Utilization:
Count of total fields populated within the MEDD(P)ICC Qualifier.
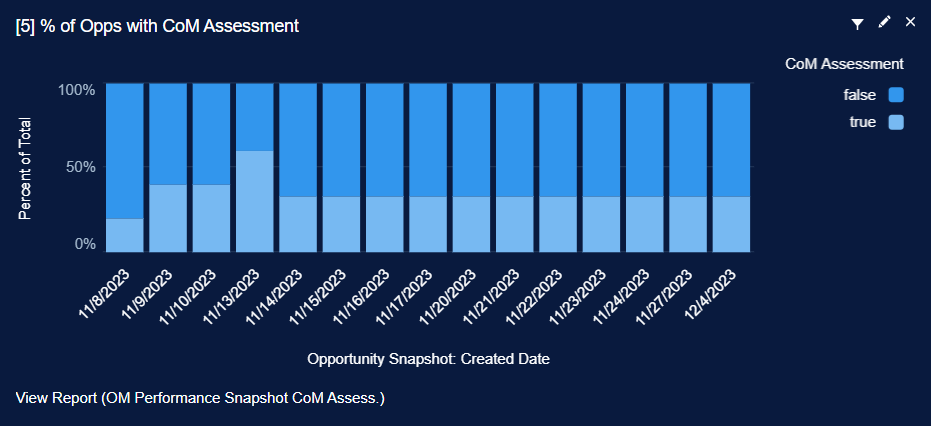
Percent of Opps with CoM Assessment:
Percentage of opportunities with completed Command of the Message Guided Assessments vs. opportunities without completed assessments.
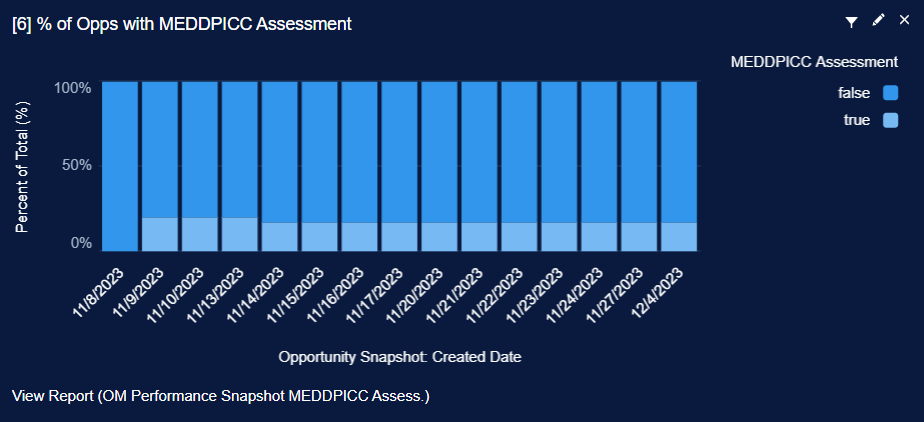
Percent of Opps with MEDDPICC Assessment:
Percentage of opportunities with completed MEDD(P)ICC Guided Assessments vs. opportunities without completed assessments.
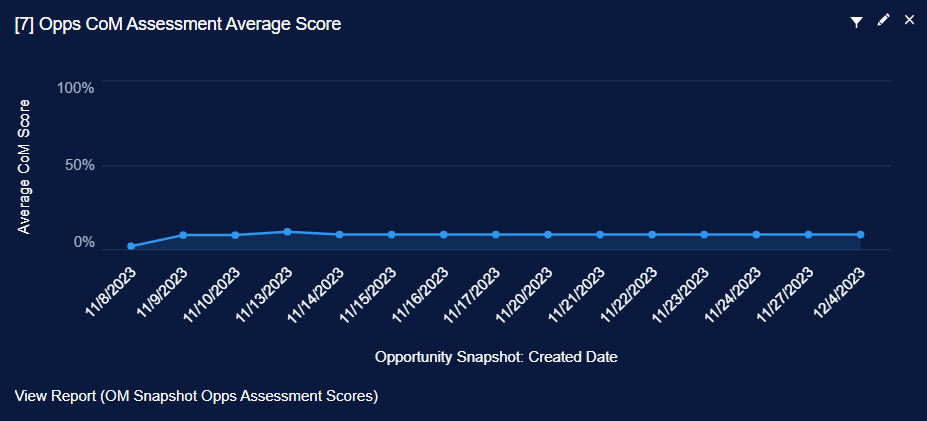
Opps CoM Assessment Average Score:
Average score of the Command of the Message Guided Assessments.
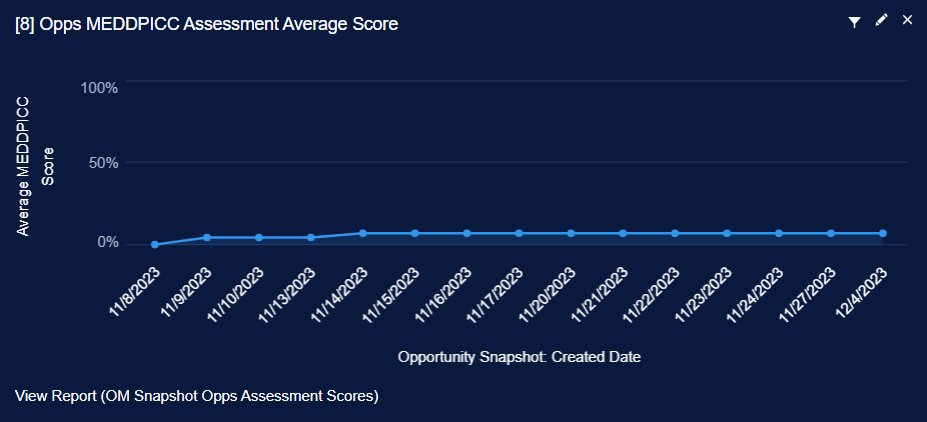
Opps MEDDPICC Assessment Average Score:
Average score of the MEDDPICC Guided Assessments.
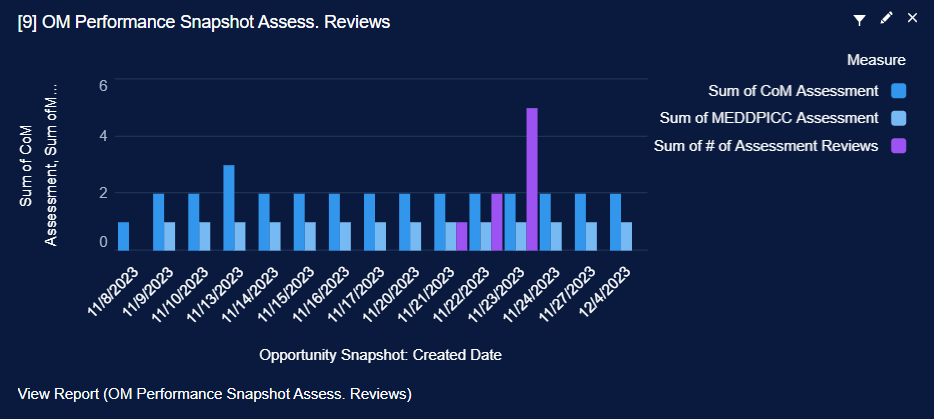
Assessment Reviews:
Count of completed Guided Assessments and Guided Assessments with Manager feedback provided.
Initial Setup for the OM Performance Dashboard
Estimated time completion: 5-10 minutes
💡 The dashboard will be blank after initial setup and will remain blank until the date/time selected for the snapshot to run has passed (steps 11 and 12 below). Once that date/time has passed, all new data entered/changed between the initial dashboard setup and report run date/time will appear on the dashboard. The dashboard cannot look backward at historical data before the dashboard is set up.
-
Navigate to “Setup” from the gear icon in the top right corner
-
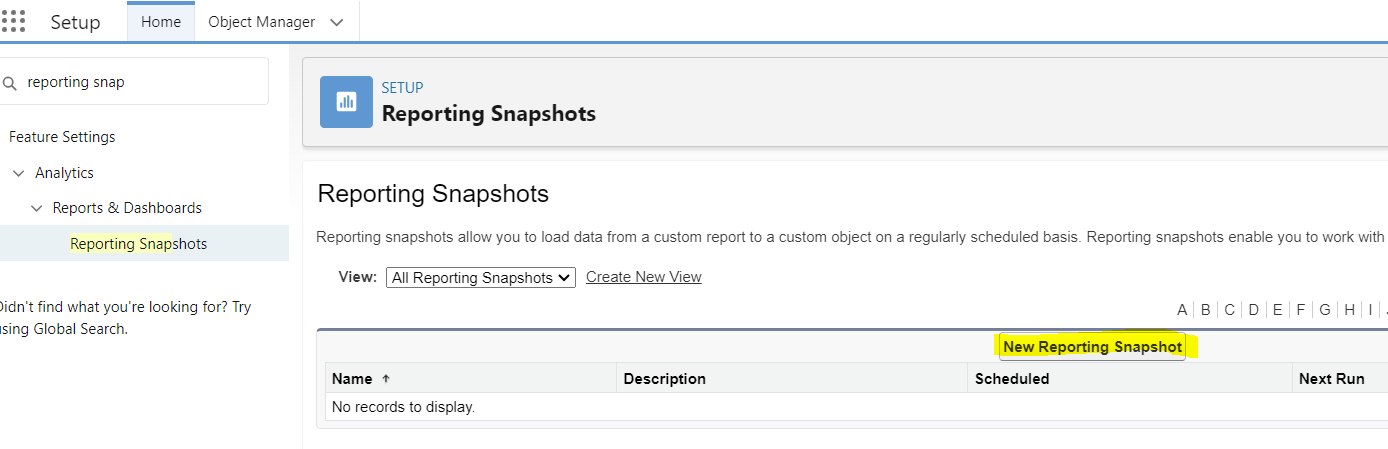
Search for and click “Reporting Snapshots” in the quick-find box
-
Click “New Reporting Snapshot”
-
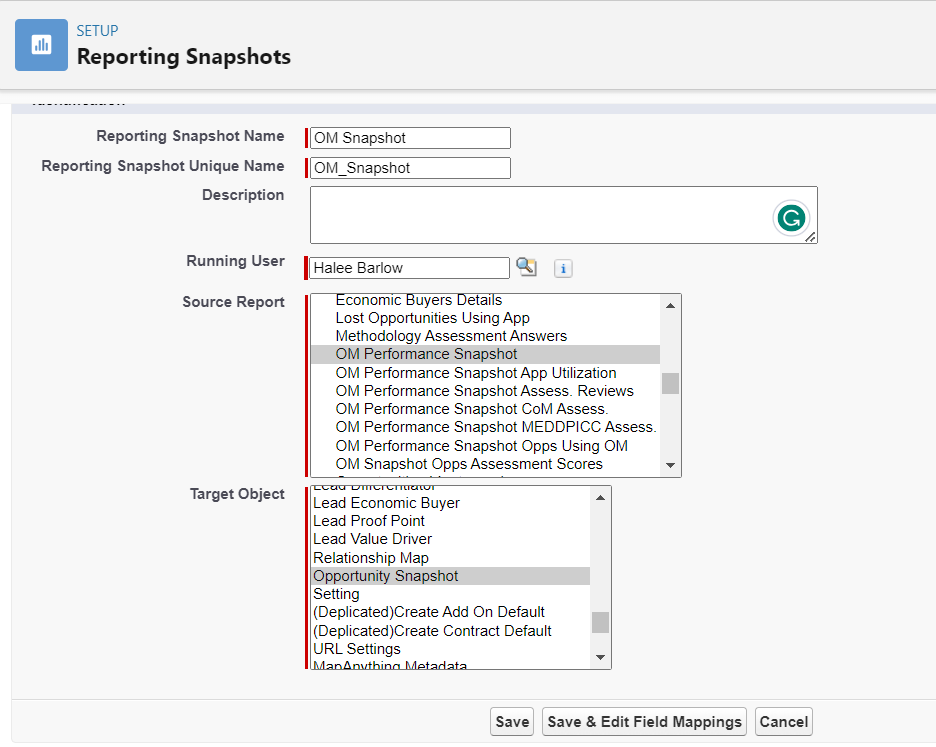
Enter the name for the snapshot as “OM Performance Snapshot”
-
The “Reporting Snapshot Unique Name” will auto-populate
-
Leave “Description” blank
-
-
Set the “Running User” as someone within your organization who has record visibility to all opportunities within the pipeline
-
Select the “Source Report” called “OM Performance Snapshot”
-
Select the “Target Object” called “Opportunity Snapshot”
-
Click “Save and Edit Field Mappings”
-
Set the field mappings to the following:
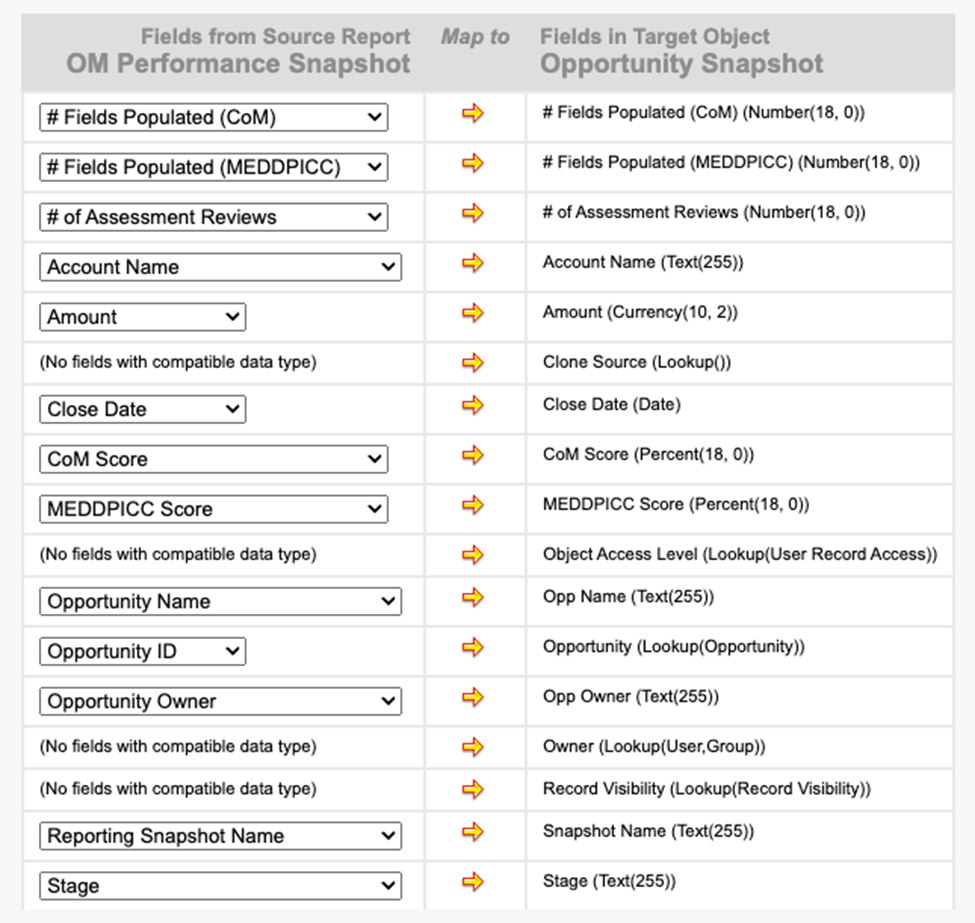
💡 If you have additional options other than what’s in the image above, leave those drop-downs as “Load No Data.”
-
Click “Save”
-
Under “Schedule Reporting Snapshot,” click “Edit”
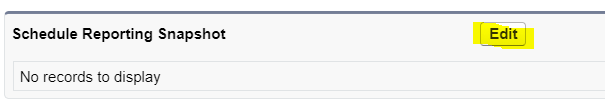
-
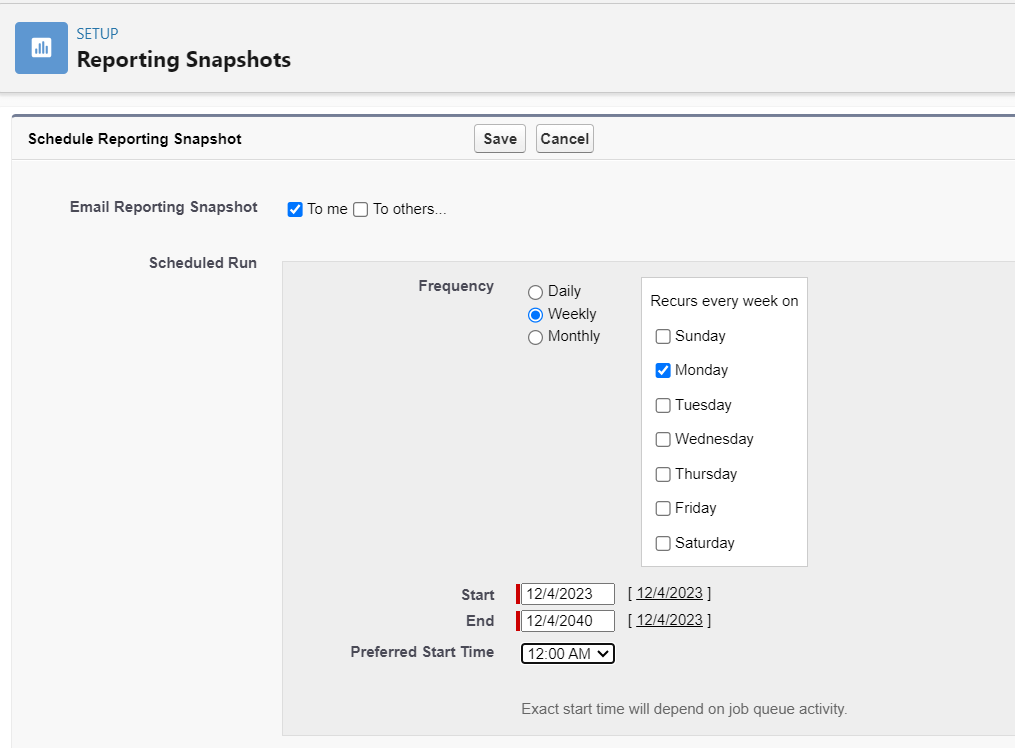
Schedule the snapshot. For example, runs weekly on Monday at 12:00am starting today and ending on a date far into the future
💡 When scheduling the snapshot, think about how often your organization will want to check this dashboard for new data activity. Any new Opportunity Manager activity will appear on the dashboard only after the scheduled run time has passed, meaning, if the report is scheduled to run once per week then the dashboard will update once per week. Pressing “refresh” on the dashboard itself will not force an update.
-
Click ‘Save’
Edit the Dashboard to Include One Methodology Only:
Required for organizations that utilize only one of Opportunity Manager’s methodologies
Estimated time completion: 2-3 minutes per report
Follow the below steps for the following 3 reports:
-
Report #1: % of Opps Using CoM / MEDDPICC Apps
-
Report #2: Count of Opps Using CoM / MEDDPICC Apps
-
Report #9: OM Performance Snapshot Assess. Reviews
-
Click the “Dashboards” tab from your SFDC ribbon
-
If you do not have this option, click the little pencil on the right-hand side to add it
-
-
Select “All Dashboards” from the left-hand side menu
-
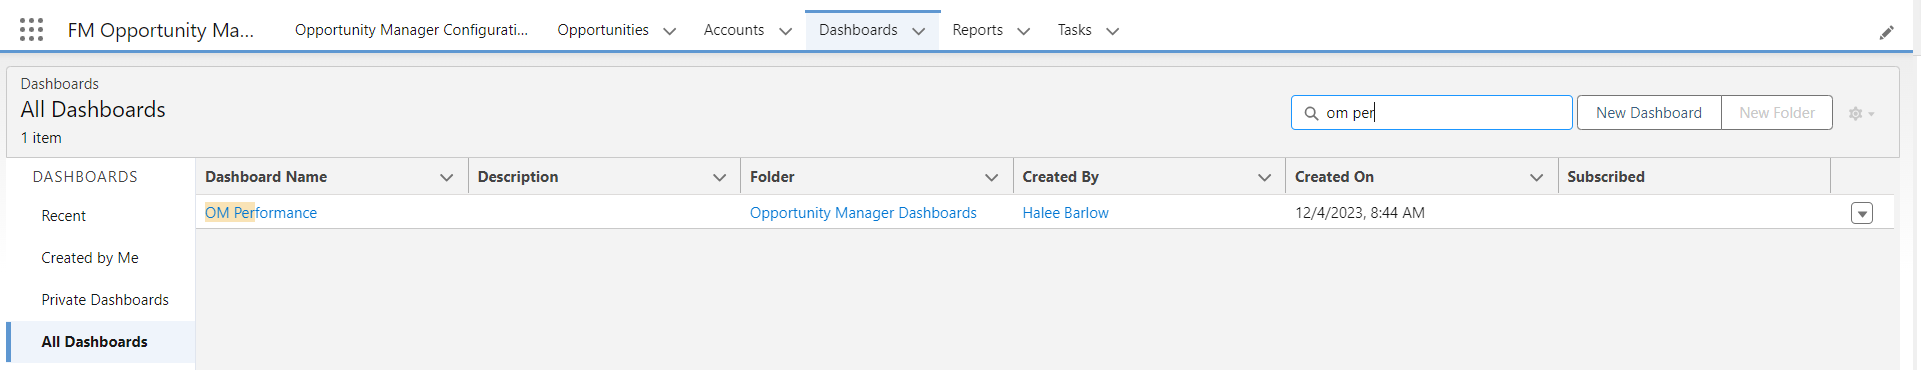
Search for the dashboard called “OM Performance” in the “Search all Dashboards” search box
-
Click on the dashboard named “OM Performance” to open it
-
On one of the reports you’d like to edit, click the “View Report” link below the chart or graph visual.
-
Click “Edit” in the top right-hand corner of the page
-
Look at the left-hand side of the screen at the list of columns
-
Delete the columns related to the methodology your organization does not use
-
Click “Save & Run” at the top right-hand corner of the page
-
Navigate back to the OM Performance dashboard and click “Refresh” in the top right-hand corner of the page
-
Click “Edit” at the top right-hand corner of the page (next to “Refresh”)
-
Click the little pencil in the right-hand corner of the graph/chart for the report you’ve just edited to open the “Edit Component” pop-up
-
Within that pop-up, scroll down to “Title”
-
Edit the report title to exclude the methodology your organization does not use
-
Click “Update” to close the pop-up
-
Click “Save” at the top right-hand corner of the page
Repeat these steps for reports #1, #2, and #9
Follow the below steps for the remainder of the reports:
Estimated time completion: 1 minute
-
Navigate to the OM Performance dashboard
-
Click “Edit” in the top right-hand corner of the page
-
Click “X” in the top right-hand corner of each report graphic that tracks the methodology your organization does not use
-
Click “Save” in the top right-hand corner of the page
Setting Dashboard Filters
Follow the below instructions to view and select the available dashboard filters
-
Navigate to the OM Performance dashboard
-
Click “Edit” at the top right-hand corner of the page
-
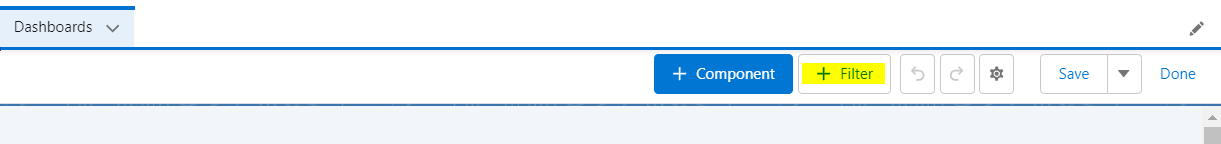
Click “+ Filter” at the top right-hand corner of the page
-
Select one of the available filters from the drop-down menu
-
Click “Add Filter Value” at the bottom of the pop-up
-
Fill in the prompts to your preference
-
Click “Add”
-
Save the dashboard with the filter by clicking “Save” in the top right-hand corner of the page
Finding the “OM Performance” Dashboard After Setup:
-
Click the “Dashboards” tab from your SFDC ribbon
-
If you do not have this option, click the little pencil on the right-hand side to add it
-
-
Select “All Dashboards” from the left-hand side menu
-
Search for the dashboard called “OM Performance” in the “Search all Dashboards” search box
-
Click on the dashboard named “OM Performance” to open it

💡 Reminder: The dashboard will be blank after initial setup and will remain blank until the date/time selected for the snapshot to run has passed (steps 11 and 12 under the initial setup steps above). Once that date/time has passed, all new data entered/changed between the initial dashboard setup and report run date/time will appear on the dashboard. The dashboard cannot look backward at historical data before the dashboard is set up.